EDL02E1: Building an Electronic Electroscope, Electric Charge, Induction, and Measurable
Electric Fields
Experimental objective. Construct an electronic electroscope based on an n-channel junction
field-effect transistor (JFET), observe electrostatic induction without contact, and turn the device
into a repeatable laboratory instrument. Then construct a low-voltage parallel-plate fixture in
which the Electric Field and an approximate stored charge can be calculated from independently
measured quantities.
This experiment is inspired by William J. Beaty’s simple MPF102 charge detector. We retain
its central idea, but add a series current-limiting resistor, an accessible current-sense
resistor, and a controlled measurement protocol. All diagrams and derivations here are
original.
1 What do we want to measure?
The fundamental questions are:
- How can a nearby charged object change a circuit without touching it?
- What is the difference between charge, electric field, and electric potential?
- How do we measure an electronic response rather than just watch an LED?
- Can we find a known electric field using voltage and geometry?
- What conclusions about charge can the detector support, and which are not justified
without calibration?
We will use two complementary instruments. The JFET detector is a high-sensitivity relative
indicator. The parallel-plate fixture provides a geometry-based estimate of a nearly uniform electric
field. Neither instrument, on its own, is a precision electrometer.
2 Apparatus and options
2.1 Minimum electronic electroscope
- One 9-volt battery and battery clip.
- One MPF102 n-channel JFET, or another verified n-channel depletion JFET, such as
J113 after verifying its operation in this circuit. The J113 has a different cutoff range
and is not a guaranteed plug-in substitute. Consult the exact part’s datasheet for pin
order.
- One red LED and one 1.0 kΩ resistor rated 0.25 W or greater.
- One 10 MΩ resistor in series with the exposed sensor Conductor. It reduces some
accidental discharge currents but does not make a semiconductor gate immune to
electrostatic damage.
- A short, insulated antenna wire, such as a 3 to 10 cm length of wire with a small
exposed tip enclosed behind insulating tape or a thin plastic cover.
- An insulated board or nonconducting case, battery switch, and leads.
- A digital multimeter (DMM) capable of measuring a few volts DC.
2.2 Experiments and upgrades
- Plastic comb or rod, wool or hair, adhesive tape, acrylic supports, a ruler, and a stand
that holds the detector stationary.
- Hygrometer, if available, to document relative humidity.
- A second isolated 1.5-volt cell for a controlled JFET bias test.
- Two square metal-foil electrodes near 10 cm × 10 cm, rigid insulating supports, and
spacers near 10 mm for the plate experiment.
- A current-limited 0 to 5 V DC supply (or an isolated 4.5 to 5 V battery pack) and a
10 kΩ supply-protection resistor.
- Optional: an additional 47 pF capacitor for sensitivity tests.
3 Safety and interpretation boundaries
- Use only battery-powered or isolated, current-limited 5 V equipment for the plate
fixture and a single 9 V battery for the detector.
- Do not use wall outlets, mains wiring, a Van de Graaff generator, piezoelectric igniters,
CRT displays, or high-voltage sources.
- Do not touch the exposed gate or bring a charged object into contact with it. Contact
and spark discharges can destroy the JFET.
- Power off before rewiring. Check LED polarity and the exact JFET drain, source, and
gate pins. Different JFET types are not pin-compatible.
- A connected oscilloscope often joins its ground clips internally and may connect them
to protective earth. Use the battery-powered DMM for this experiment. Do not connect
an oscilloscope ground clip to an unknown charged object or a floating gate.
- Keep metal foil edges covered and do not allow the plate electrodes to touch. Energize
the plate fixture only after inspecting the gap.
- Avoid operating the sensitive detector near flammable vapors or spark-producing
demonstrations.
The JFET detector responds to changes in its gate-to-source potential difference, not directly to
the Coulomb force on a test charge. LED brightness is not an absolute measurement of charge,
field magnitude, or potential. In particular, a change caused by a neutral hand near the sensor can
result from altered capacitances and field geometry.
4 Part I: Electrostatics behind the detector
4.1 Charge and charge conservation
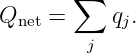
Electric charge is a property of matter, expressed in coulombs. A body’s net charge is the algebraic
sum of its positive and negative charge:
An electrically neutral object contains charge but has equal total positive and negative
contributions. When two unlike insulating surfaces contact and separate, they may acquire
opposite net charges. Electron transfer and other surface and material-transfer processes can
contribute. In a closed system, the total charge is conserved:
Important limit. Opposite detector responses do not establish that |QA| = |QB|. Their shapes,
dielectric properties, distance, capacitance, and leakage can be different. A transfer measurement
with an enclosed Faraday cup and calibrated charge amplifier would be needed to make a stronger
quantitative claim.
4.2 Coulomb field and potential
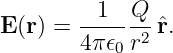
For an ideal point charge Q in free space, the electric field outside the charge is
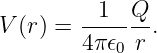
The electric potential relative to infinity is
The defining relation between these quantities is
Thus electric field measures the spatial rate of change of potential, not simply the potential itself.
The distinction matters for an electronic detector, whose gate acts as a small conductor with a
voltage relative to its surrounding circuit.
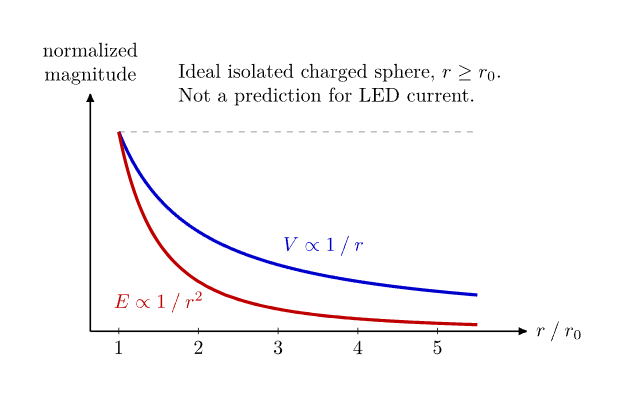
Figure 1. Outside an ideal charged sphere, electric potential decreases as 1∕r while electric field
decreases as 1∕r2. These are theoretical field curves, not predictions of the detector LED
brightness.
For illustration, at a point 0.10 m from an isolated 1 nC charge,
These values come from the ideal point-charge model. A real comb or piece of tape is
distributed, its charge changes with humidity, and a nearby conductor changes the boundary
conditions. Do not assign a numerical value of Q to the comb merely from the detector
response.
4.3 Why a floating gate responds without contact
The JFET gate is connected to a small conducting sensor electrode. The surrounding charged
object, the battery, a person’s body, and the room’s surfaces form a network of capacitances. A
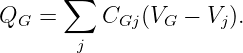
simplified charge relation for the isolated gate conductor is
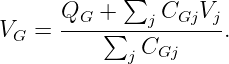
If the gate has been placed in a repeatable initial state and has negligible leakage, its net charge is
approximately fixed during an approach. Algebra gives
The capacitances themselves depend on the positions of the source object, the circuit, and the
observer. An approaching object therefore changes V G, even when no net charge crosses the air
gap. The JFET responds to
where V S is the transistor source-node potential.
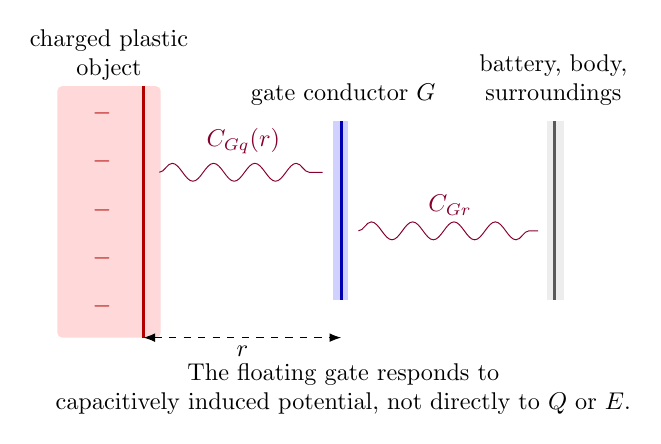
Figure 2. Simplified capacitance network around the floating gate. The object-to-gate coupling
increases as geometry changes; the detector’s battery and nearby objects provide a second
capacitive reference.
Because the gate and the battery move relative to the surroundings, the detector measures a
response of the whole electrostatic arrangement. This is why holding the battery while moving a
hand can alter a reading.
5 Part II: JFET physics and a measurable output
5.1 Why the transistor is sensitive
An n-channel depletion JFET carries drain current through a conducting channel. The
gate-channel junction is normally reverse biased. Increasing negative V GS expands the depletion
region and reduces the channel’s conducting cross-section.
In an approximate saturation-region model,
where V P < 0 is a cutoff parameter. This equation is a simplified JFET model, not an exact
calibration formula for this LED circuit. The actual bias point depends on device variation and the
load line.
The MPF102 datasheet permits a broad range of drain currents. Two devices with identical
markings can show visibly different responses. The gate current also need not be exactly zero.
Insulator contamination and surface humidity can create additional leakage.
The charged object does not power the LED. It perturbs the gate potential, which changes how
much energy flows from the 9 V battery through the transistor, resistor, and LED.
5.2 The current-sense resistor
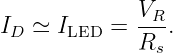
To turn brightness into an electrical reading, add a 1.0 kΩ series resistor in the same branch as
the JFET and LED. Connect the DMM in its DC-voltage mode across this resistor.
Then
For example, a voltage V R = 3.20 V across Rs = 1.00 kΩ corresponds to
This is an arithmetic example, not measured EDL data. Read your actual Rs with the circuit
unpowered and use its measured value in the analysis.
The 1 kΩ resistor also limits battery current to less than 9 mA in the idealized worst case, even if
the JFET conducts strongly. This reduces the risk of LED overcurrent compared with a circuit
that relies solely on the JFET to limit current.
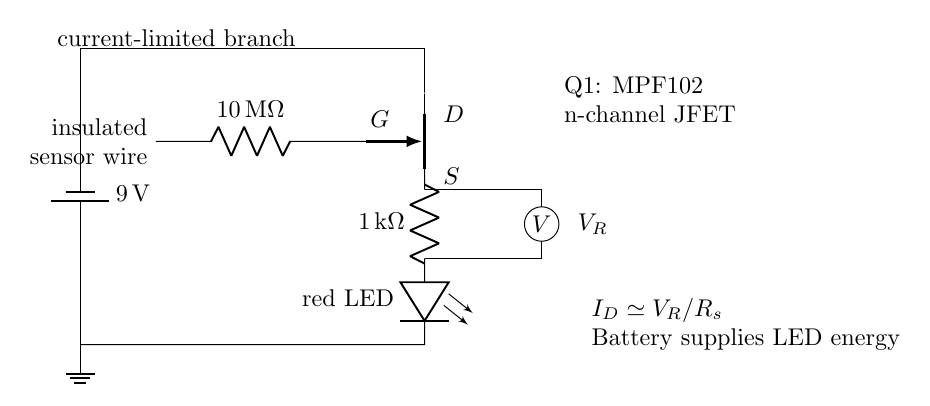
Figure 3. Measurement version of the Beaty-inspired JFET detector. The DMM measures the
voltage across the 1kΩ sense resistor. The 10MΩ sensor-series resistor is an added precaution, not
guaranteed electrostatic-discharge protection. The transistor is drawn symbolically; identify its
pins from its own datasheet.
6 Part III: Construct the electronic electroscope
6.1 Assembly
- Disconnect the 9 V battery. Identify the MPF102 drain, source, and gate from its
datasheet, rather than from the physical shape alone.
- Connect the battery positive terminal to the transistor drain.
- Connect the transistor source through the 1 kΩ sense resistor and then through the
LED to battery negative. Observe LED polarity.
- Connect the short antenna conductor to the gate through a 10 MΩ series resistor. Do
not extend the antenna to an exposed metal spike or other spark-prone geometry.
- Provide labeled DMM test points at the two ends of the sense resistor.
- Keep the assembly on dry insulating material. Enclose the antenna tip behind a thin
plastic barrier.
- Inspect all wiring. Connect the battery, and observe whether the LED illuminates.
Some devices may need a different JFET or a shorter antenna because of
component-to-component variation.
- Read the baseline voltage V R,0 with the DMM on its voltage range. Do not put the
DMM into its current mode across the circuit.
An initial gate reset can be made with the battery disconnected by briefly shorting the gate node
to the JFET source through a jumper and then removing the jumper before measurement.
Avoid touching the exposed semiconductor lead. Repeat the same reset method between
trials.
6.2 Controlled electrical test, before using static charge
A controlled negative gate bias confirms that the device can modulate current without relying on
uncertain rubbing or peeling.
- Record the baseline V R,0 after the usual reset.
- Use a separate isolated 1.5 V cell. Temporarily connect its positive terminal to the
JFET source node and its negative terminal to the JFET gate through the 10 MΩ
resistor.
- This imposes approximately V GS = −1.5 V while connected. Record V R. The current
should usually decrease, although the amount depends on the individual JFET.
- Remove the bias cell, power off the detector, reset the gate, and repeat. Do not apply
a positive gate bias or directly connect an unknown electrostatically charged object to
the gate.
Because the JFET has a nonlinear load line, this one-point test establishes an input-to-output
response, not a complete transistor transfer curve. A dedicated characterization setup would sweep
V GS while measuring both V DS and ID.
7 Part IV: Experiment A, response versus distance
Question. Does the magnitude of the detector’s electrical response change reproducibly as a
charged object approaches its antenna?
7.1 Procedure
- Mount the detector rigidly. Keep the DMM, battery, ruler, and operator in fixed
positions. Mark the sensor tip as the distance reference.
- Electrify a plastic comb or rod using a repeatable contact/separation method. Support
it by an insulating holder.
- With the rod far away, reset the gate and record the baseline V R,0.
- Move the rod to a predetermined position, beginning well away from the detector. Keep
a noncontact gap; do not allow sparks or contact.
- Record the distance r, the sense-resistor voltage V R, and the elapsed time since
electrification. Record humidity if available.
- Withdraw the rod and repeat the reset. Test at several distances. Randomize the
distance order across repeated trials to reduce the influence of charge leakage with
time.
- Repeat using a longer sensor wire, then with the original short wire. Record the antenna
geometry in both cases.
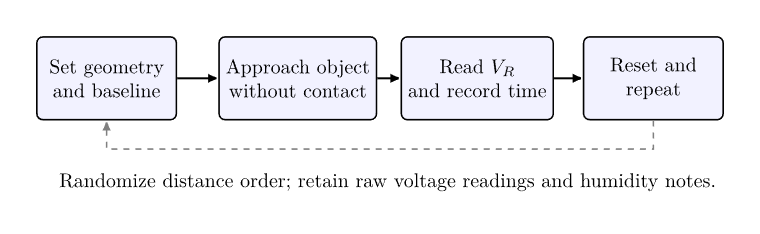
Figure 4. The experimental workflow. Randomized repeated trials are more informative than a
single approach sweep because the charge on a rubbed object can decay while measurements are
being made.
For each reading, calculate
Plot ΔID against distance. State the sign convention clearly. Plot repeated trials separately before
averaging them. A systematic response is evidence of electrostatic coupling; it is not a direct
measurement of Q∕r2.
A change in the detector’s response with a longer wire is evidence that the coupling capacitance
matters. If the response becomes erratic, shorten the wire again and add a fixed shield or a small
known gate-to-source capacitor to reduce sensitivity. Any added capacitance changes the
instrument and must be recorded.
8 Part V: Experiment B, opposite charges and induction
Question. Can electrification by contact and separation create two objects that respond with
opposite polarities?
- Make two thin adhesive-tape strips with folded handling tabs.
- Gently press their surfaces together, separate them, and support them on independent
insulating handles.
- Reset the detector and approach with strip A. Record the direction and magnitude of
ΔID at a fixed distance.
- Reset and approach with strip B using the same nominal geometry.
- Repeat with another pair of materials. If the signals have the same sign or no discernible
response, record that result rather than assigning a polarity by assumption.
The charges on the pair can be opposite after separation, and their mutual attraction is a useful
independent observation. However, a detector response can depend on the sample’s geometry, the
observer, and its history of gate reset. Without calibration, it cannot certify either the exact sign of
Q or equality of the two charge magnitudes.
9 Part VI: Experiment C, electrostatic shielding
Question. Why does a conductor change the detector response even when the conductor has no
intentional net charge?
- Fix a charged object and sensor at a separation that produces a repeatable response.
Record V R without any screen.
- Insert a broad aluminum-foil sheet mounted on an insulating frame between the two,
without touching the gate.
- Repeat with the foil electrically connected to the detector battery negative terminal.
Use an insulated lead and only the low-energy detector circuit.
- Compare the response with no screen, isolated foil, and foil tied to the battery return.
Keep positions identical.
- Vary foil size while keeping its distance to the sensor fixed.
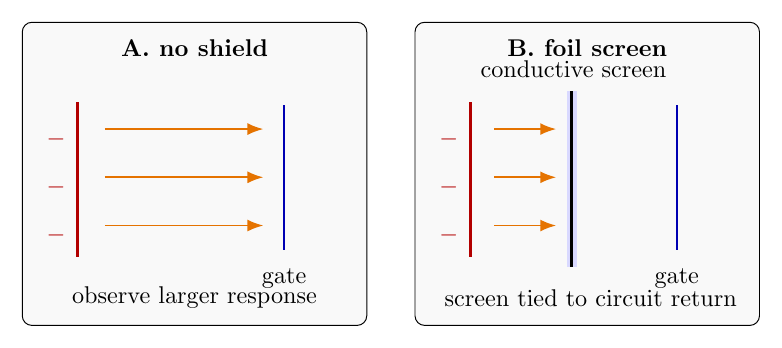
Figure 5. Shielding comparison. A conductive screen redistributes surface charge and changes
capacitive coupling. Shielding is not generally perfect at finite foil edges or with an incompletely
enclosed sensor.
For an ideal conductor in electrostatic equilibrium,
These are the boundary conditions behind shielding and electrostatic induction. A simple isolated
sheet is not a closed Faraday cage; the experiment should reveal the effect of size, placement, and
grounding.
10 Part VII: Experiment D, a quantitative parallel-plate field
The electronic electroscope is not a calibrated field meter. We can still construct a known field
geometry using two electrodes and a measured voltage, then use the detector as a relative observer
near the fringe field.
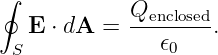
10.1 Gauss’s law and the field between plates
Gauss’s Law is
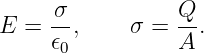
An ideal infinite plane of uniform surface charge density σ produces a field of magnitude σ∕(2𝜖0)
on either side. With two ideal oppositely charged plates, the fields add between the plates and
cancel outside. Thus,
Using V = Ed in the approximately uniform central region,
Combining the relations gives
These equations neglect fringing, dielectric support materials, and surface nonuniformities.
The narrower the gap compared with the plate dimensions, the better the central-field
approximation.
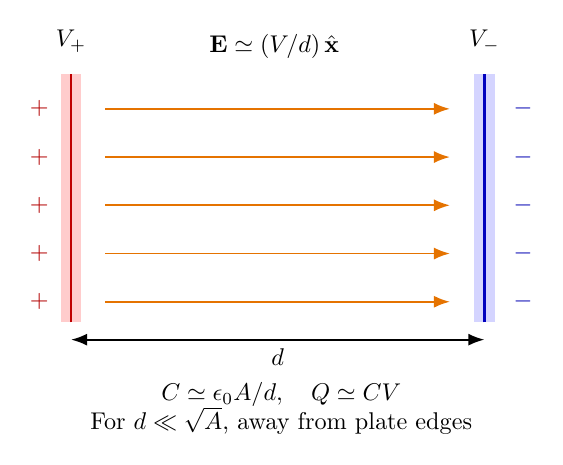
Figure 6. Opposing parallel plates create an approximately uniform field in the central region.
The voltage and separation provide an estimate of E without using LED brightness as a
calibration standard.
10.2 Build and measurement procedure
- Make two square foil electrodes with measured side lengths, nominally 0.10 m. Attach
them to flat, stiff insulating plates with clean edges. Cover exposed foil edges.
- Use nonconducting corner spacers to set a measurable gap, initially about 0.010 m. Do
not place a large solid dielectric slab in the center if the air-gap formula is to be tested
directly.
- Connect a 0 to 5 V current-limited supply to the electrodes, with a 10 kΩ protection
resistor in series with one lead.
- Connect the DMM across the plates. Measure the actual electrode voltage, not merely
the supply setting.
- For each voltage, compute Emodel = |V |∕d.
- Repeat at two or three plate spacings. Keep the electrode dimensions constant.
Re-measure the gap rather than assuming the spacers are exact.
- If a FET detector response can be observed near one edge, record it as a separate
fringing-field indicator. Do not force the detector into the central region or claim that
its output equals E.
10.3 Numerical prediction
For square plates of area A = 0.0100 m2, separated by d = 0.0100 m, with V = 5.00 V,
| Emodel | ≃ 500 V∕m, | (19)
|
| Cmodel | ≃ 8.85 pF, | (20)
|
| Qmodel | ≃ 44.3 pC, | (21)
|
| Umodel | ≃ CV 2 ≃ 1.11 × 10⁻¹⁰ J. | (22) |
Here Qmodel is the estimated magnitude of charge on one plate, not the net charge of both plates
combined. The two plates have approximately +Q and −Q.
The field estimate is based on the measured potential difference and geometry. The plate
charge estimate is less reliable because the actual capacitance includes edge and stray
contributions.
10.4 Why a voltmeter does not directly measure free charge
With the supply connected, the DMM reads the plate potential difference. When the supply is
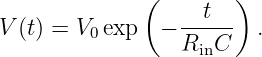
removed, the DMM itself provides a leakage path. If its input resistance is Rin, a simple discharge
model gives
At Rin = 10 MΩ and C = 8.85 pF,
A Normal DMM therefore cannot be expected to display the small isolated capacitor’s original
voltage after disconnection. The measuring instrument changes the experiment. This is the same
measurement-loading issue developed in EDL01.
11 Part VIII: Optional add-on, known-charge calibration concept
A stronger charge measurement requires a calibrated electrometer. A practical future upgrade is an
enclosed conducting cup connected to the input of a guarded charge amplifier. In a simplified ideal
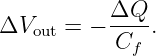
charge-amplifier model with feedback capacitance Cf,
For example, Cf = 1.0 nF would ideally produce a 1.0 V output step for a collected charge of
magnitude 1.0 nC. The amplifier requires suitable input protection, reset capability, leakage
control, and a demonstrated calibration. It is a separate instrument, not a measurement feature of
the single-JFET LED detector.
A safe calibration source for that future instrument can use a known capacitor and a low-voltage
supply, because
For instance, 100 pF charged to 5.0 V represents 0.50 nC of charge magnitude on each capacitor
electrode. The actual transfer to a measurement input depends on the switching and connection
geometry; simply touching one lead to an unknown sensor does not guarantee delivery of the entire
nominal charge.
12 Part IX: Error analysis and data integrity
12.1 Current measurement
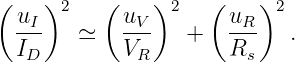
For the measured sense voltage V R and resistor value Rs,
For independent small uncertainties,
For a response measurement, baseline drift and humidity may dominate the quoted DMM and
resistor tolerances. Record these as systematic limitations rather than adding unsupported decimal
precision.
12.2 Field model
With E = V∕d,
The formula describes the uncertainty of the ideal-model estimate. Fringing and geometry
imperfections can introduce additional model bias. Likewise, the ideal plate-charge estimate scales
as Q ∝ AV∕d, so uncertainties in electrode area matter.
12.3 What counts as a successful result?
- Record an actual baseline voltage V R,0 and its trial-to-trial drift.
- Show repeatable changes in V R for a fixed electrified object at fixed distance and
geometry.
- Document what happens with shielded and unshielded geometries.
- Obtain at least one calculated plate-field value from measured electrode voltage and
gap.
- Report which results are measured, which are modeled, and which are merely
qualitative observations.
13 Part X: Questions and worked explanations
Question 1: Why can the detector work without touching the object?
The electric field redistributes charge on the floating gate electrode. The mutual capacitance
between the charged object and the gate changes with distance. The gate-to-source potential
changes, which modifies drain current and therefore LED brightness. No net charge must cross the
air gap.
Question 2: A negative object makes the LED dim. Did the object supply negative current to the
LED?
No. The battery supplies current in the LED branch. The negative object changes the JFET’s
electrostatic gate bias, generally decreasing the current for this n-channel device under suitable
initial conditions.
Question 3: Why can the LED response not be fitted to 1∕r2 to find charge?
The law E ∝ 1∕r2 applies to an ideal point charge at a fixed charge value. The detector output
follows a nonlinear semiconductor characteristic and a changing capacitive network. Even a perfect
1∕r2 field would not imply an LED current proportional to 1∕r2.
Question 4: What if the plate gap is halved with voltage fixed?
In the ideal parallel-plate model,
so the field doubles. Also C = 𝜖0A∕d doubles, and the magnitude of charge supplied by the voltage
source doubles. These statements assume the voltage remains fixed and the approximation remains
valid.
Question 5: Why is a charged comb not required for the plate-field measurement?
The regulated low-voltage source places known opposite charges on the plates. Their potential
difference produces the electric field. Static electrification by rubbing is not the only way to create
an electric field.
Question 6: Can the detector establish charge conservation for two tape strips?
Opposite responses are consistent with contact electrification and charge separation, but they are
not a quantitative measurement of equal and opposite charge. Conservation of charge is a
fundamental theoretical constraint; showing it quantitatively requires charge calibration and a
complete account of charge transferred to the environment.
14 Connections to the PhysicsLibrary sequence
- EDL01: voltage measurement, source loading, and meter impedance.
- EDL02: electrostatic fields, induction, and electrometers.
- EDL03: mapping V (x,y) and reconstructing E = −∇V .
- EDL04: capacitance and dielectric materials.
- Electromagnetism theory: Gauss’s law, potential, conductors, and electrostatic
boundary conditions.
The major lesson is that field measurements depend on an apparatus model. A sensitive detector
can demonstrate the existence of an electrostatic interaction, but sensitivity alone does not provide
a measurement scale. Quantitative physics requires an independently established relationship
between observable output and the intended physical quantity.
15 References and attribution
- William J. Beaty, “Ridiculously Sensitive Electric Charge Detector,” original circuit
and experiment collection (1987), eskimo.com/~billb/emotor/chargdet.html.
- onsemi, MPF102: JFET VHF Amplifier, manufacturer datasheet.
- OpenStax, University Physics, Volume 2, sections 5.5, 6.4, and 8.1, on electric field,
conducting boundary conditions, and capacitance.
- PhysicsLibrary, EDL00 and EDL01.