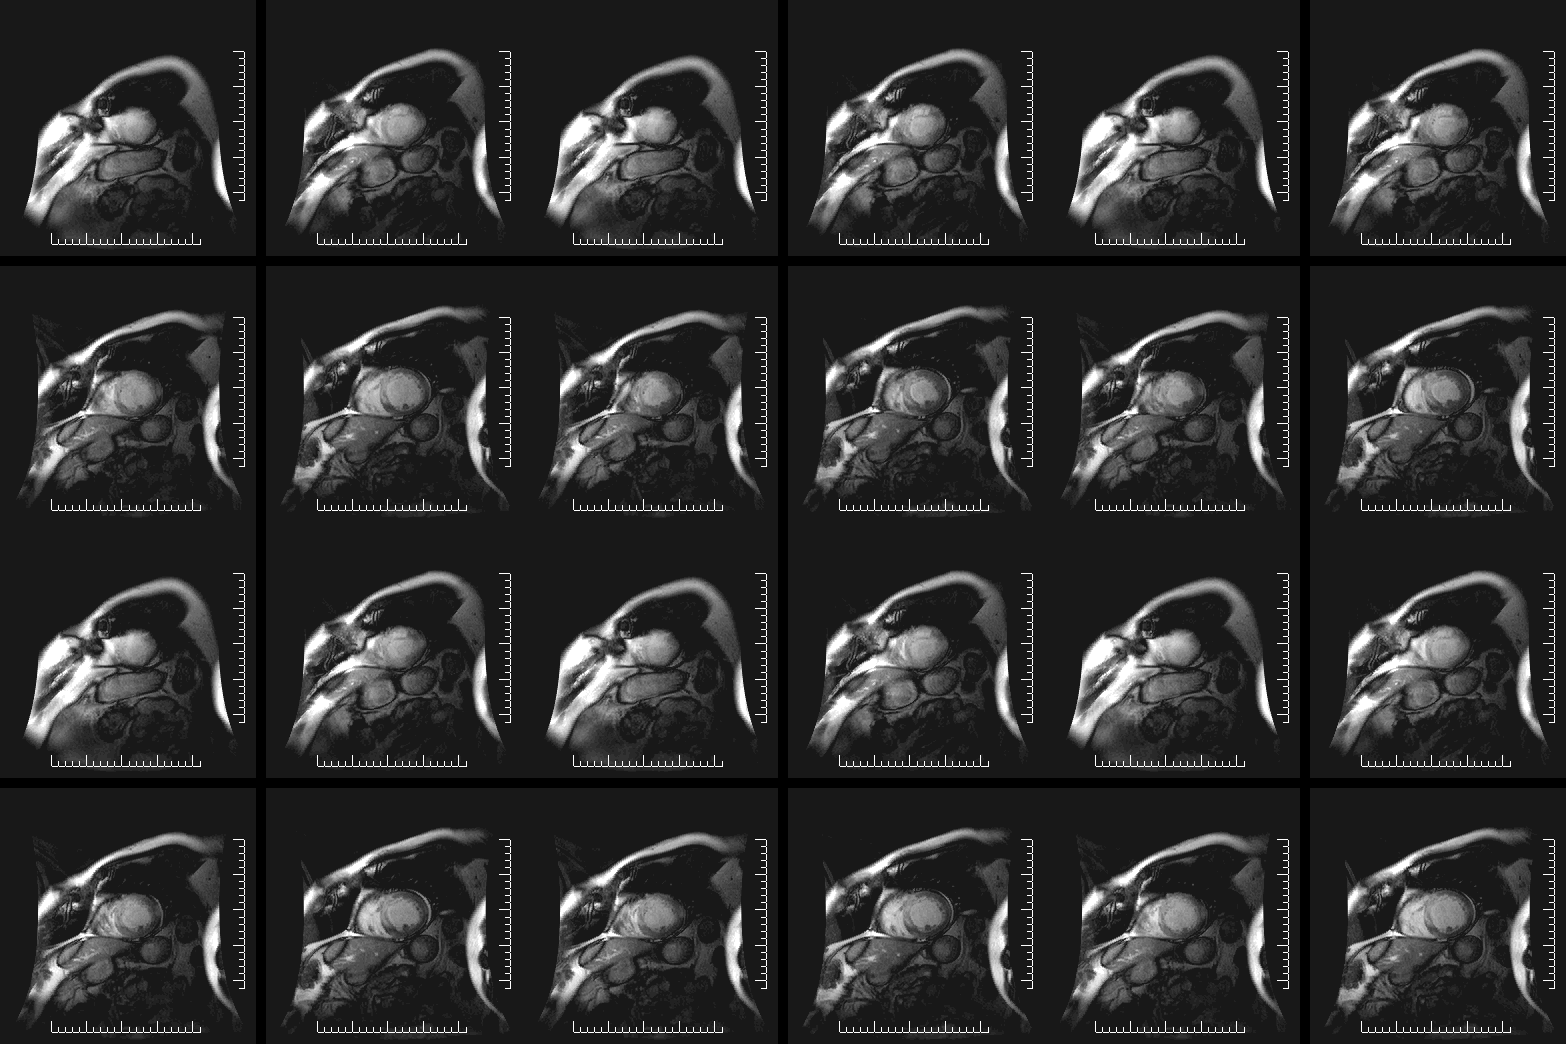
0.1 Two-dimensional Fourier transform imaging
A two-dimensional Fourier transform (2D-FT) is computed numerically or carried out in two
stages, both involving ‘standard’, one-dimensional Fourier transforms. However, the second stage
Fourier transform is not the inverse Fourier transform (which would result in the original function
that was transformed at the first stage), but a Fourier transform in a second variable– which is
‘shifted’ in value– relative to that involved in the result of the first Fourier transform. Such 2D-FT
analysis is a very powerful method for three-dimensional reconstruction of polymer
and biopolymer structures by two-dimensional Nuclear Magnetic resonance (2D-FT
NMR , [1]) of solutions for molecular Weights (Mw) of the dissolved polymers up to
about 50,000 Mw. For larger biopolymers or polymers, more complex methods have been
developed to obtain the desired resolution needed for the 3D-reconstruction of higher
molecular structures, e.g. for 900, 000Mw, methods that can also be utilized in vivo.
The 2D-FT method is also widely utilized in optical spectroscopy, such as 2D-FT NIR
Hyperspectral Imaging, or in MRI imaging for research and clinical, diagnostic applications in
Medicine.
A more precise mathematical definition of the ‘double’ Fourier transform involved is specified next,
and a precise example follows the definition.
Definition 0.1. A 2D-FT, or two-dimensional Fourier transform, is a standard Fourier
transformation of a function of two variables, f(x1,x2), carried first in the first variable
x1, followed by the Fourier transform in the second variable x2 of the resulting function
F(s1,x2). (For further specific details and example for 2D-FT Imaging v. URLs provided in
the following recent Bibliography).
Example 0.1 A 2D Fourier transformation and phase correction is applied to a set of 2D NMR
(FID) signals s(t1,t2) yielding a real 2D-FT NMR ‘spectrum’ (collection of 1D FT-NMR spectra)
represented by a matrix S whose elements are
where ν1 and ν2 denote the discrete indirect double-quantum and single-quantum(detection) axes,
respectively, in the 2D NMR experiments. Next, the covariance matrix is calculated in the
frequency domain according to the following equation:
with ν2,ν2′ taking all possible single-quantum frequency values and with the summation carried
out over all discrete, double quantum frequencies ν1.
0.2 Example 0.2
Atomic structure reconstruction by 2D-FT of STEM Images(obtained at Cornell University)
reveals the electron distributions in a high-temperature cuprate superconductor ‘paracrystal’; both
the domains (or ‘location’) and the local symmetry of the “pseudo-gap” are seen in the
electron-pair correlation band responsible for the high–temperature superconductivity effect
.
0.3 Remarks
So far there have been three Nobel prizes awarded for 2D-FT NMR/MRI during 1992-2003, and an
additional, earlier Nobel prize for 2D-FT of X-ray data (‘CAT scans’); recently the advanced
possibilities of 2D-FT techniques in Chemistry, Physiology and Medicine received very significant
recognition.
References
[1] Kurt Wütrich: 1986, NMR of Proteins and Nucleic Acids., J. Wiley and Sons: New
York, Chichester, Brisbane, Toronto, Singapore. (Nobel Laureate in 2002 for 2D-FT
NMR Studies of Structure and Function of Biological Macromolecules); 2D-FT NMR
Instrument Image Example: a JPG color image of a 2D-FT NMR Imaging ‘monster’
Instrument
[2] Richard R. Ernst. 1992. Nuclear Magnetic Resonance Fourier Transform (2D-FT)
Spectroscopy. Nobel Lecture, on December 9, 1992.
[3] Peter Mansfield. 2003. Nobel Laureate in Physiology and Medicine for (2D and 3D)
MRI.
[4] D. Benett. 2007. PhD Thesis. Worcester Polytechnic Institute. (lots of 2D-FT images
of mathematical, brain scans.) PDF of 2D-FT Imaging Applications to MRI in Medical
Research.
[5] Paul Lauterbur. 2003. Nobel Laureate in Physiology and Medicine for (2D and 3D)
MRI.
[6] Jean Jeener. 1971. Two-dimensional Fourier Transform NMR, presented at an
Ampere International Summer School, Basko Polje, unpublished. A verbatim quote follows
from Richard R. Ernst’s Nobel Laureate Lecture delivered on December 2nd, 1992, “A
new approach to measure two-dimensional (2D) spectra has been proposed by Jean Jeener
at an Ampère Summer School in Basko Polje, Yugoslavia, 1971 ([6]). He suggested a 2D
Fourier transform experiment consisting of two π∕2 pulses with a variable time t1 between
the pulses and the time variable t2 measuring the time elapsed after the second pulse as
shown in Fig. 6 that expands the principles of Fig. 1. Measuring the response s(t1,t2) of
the two-pulse sequence and Fourier-transformation with respect to both time variables
produces a two-dimensional spectrum S(O1,O2) of the desired form. This two-pulse
experiment by Jean Jeener is the forefather of a whole class of 2D experiments that can
also easily be expanded to multidimensional spectroscopy.”
[7] A 2D-FT NMRI article and Spectroscopy.
[8] Cardiac infarct movies by 2D-FT NMR Imaging


![′ T ∑ ′
C (ν2,ν2) = S S = [S (ν1,ν 2)S (ν1,ν2)],
ν1](https://images.physicslibrary.org/cache/objects/349/make4ht/2DFTImaging1x.png)