In addition to visible and infrared radiation, radio waves from astronomical objects can also be
detected from the surface of Earth. In the early 1930s, Karl G. Jansky, an engineer at Bell
Telephone Laboratories, was experimenting with antennas for long-range radio communication
when he encountered some mysterious static—radio radiation coming from an unknown
source (Figure 6.17). He discovered that this radiation came in strongest about four
minutes earlier on each successive day and correctly concluded that since Earth’s sidereal
rotation period (how long it takes us to rotate relative to the stars) is four minutes
shorter than a solar day, the radiation must be originating from some region fixed on the
Celestial Sphere. Subsequent investigation showed that the source of this radiation was
part of the Milky Way Galaxy; Jansky had discovered the first source of cosmic radio
waves.
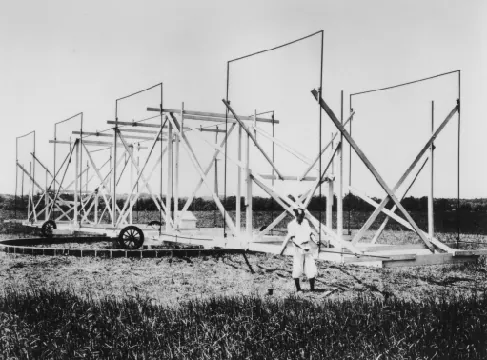
Figure 6.17 First Radio Telescope. This rotating radio antenna was used by Jansky in his
serendipitous discovery of radio radiation from the Milky Way.
In 1936, Grote Reber, who was an amateur astronomer interested in radio communications, used
galvanized iron and wood to build the first antenna specifically designed to receive cosmic radio
waves. Over the years, Reber built several such antennas and used them to carry out
pioneering surveys of the sky for celestial radio sources; he remained active in radio
astronomy for more than 30 years. During the first decade, he worked practically alone
because professional astronomers had not yet recognized the vast potential of radio
astronomy.
Detection of Radio Energy from Space
It is important to understand that radio waves cannot be “heard”: they are not the sound waves
you hear coming out of the radio receiver in your home or CAR. Like Light, radio waves are a
form of electromagnetic radiation, but unlike light, we cannot detect them with our
senses—we must rely on electronic equipment to pick them up. In commercial radio
broadcasting, we encode sound information (music or a newscaster’s voice) into radio waves.
These must be decoded at the other end and then turned back into sound by speakers or
headphones.
The radio waves we receive from space do not, of course, have music or other program information
encoded in them. If cosmic radio signals were translated into sound, they would sound like the
static you hear when scanning between stations. Nevertheless, there is information in the radio
waves we receive—information that can tell us about the chemistry and physical conditions of the
sources of the waves.
Just as vibrating charged particles can produce electromagnetic waves (see the Radiation and
Spectra chapter), electromagnetic waves can make charged particles move back and forth. Radio
waves can produce a current in Conductors of electricity such as metals. An antenna is
such a conductor: it intercepts radio waves, which create a feeble current in it. The
current is then amplified in a radio receiver until it is strong enough to measure or
record.
Like your television or radio, receivers can be tuned to select a single frequency (channel). In
astronomy, however, it is more common to use sophisticated data-processing techniques that allow
thousands of separate frequency bands to be detected simultaneously. Thus, the astronomical radio
receiver operates much like a spectrometer on a visible-light or infrared telescope, providing
information about how much radiation we receive at each wavelength or frequency.
After computer processing, the radio signals are recorded on magnetic disks for further
analysis.
Radio waves are reflected by conducting surfaces, just as light is reflected from a shiny metallic
surface, and according to the same laws of optics. A radio-reflecting telescope consists of a concave
metal reflector (called a dish), analogous to a telescope mirror. The radio waves collected by
the dish are reflected to a focus, where they can then be directed to a receiver and
analyzed.
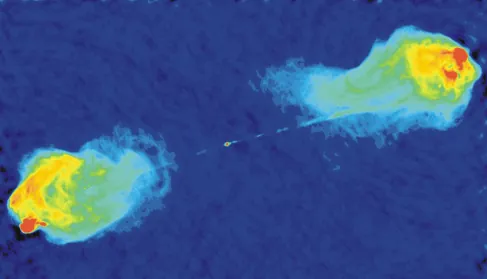
Because humans are such visual creatures, radio astronomers often construct a pictorial
representation of the radio sources they observe. Figure 6.18 shows such a radio image of a distant
galaxy, where radio telescopes reveal vast jets and complicated regions of radio emissions that are
completely invisible in photographs taken with light.
Figure 6.18 Radio Image. This image has been constructed of radio observations at the Very Large
Array of a galaxy called Cygnus A. Colors have been added to help the eye sort out regions of
different radio intensities. Red regions are the most intense, blue the least. The visible
galaxy would be a small dot in the center of the image. The radio image reveals jets of
expelled material (more than 160,000 light-years long) on either side of the galaxy. (credit:
NRAO/AUI)
Radio astronomy is a young field compared with visible-light astronomy, but it has experienced
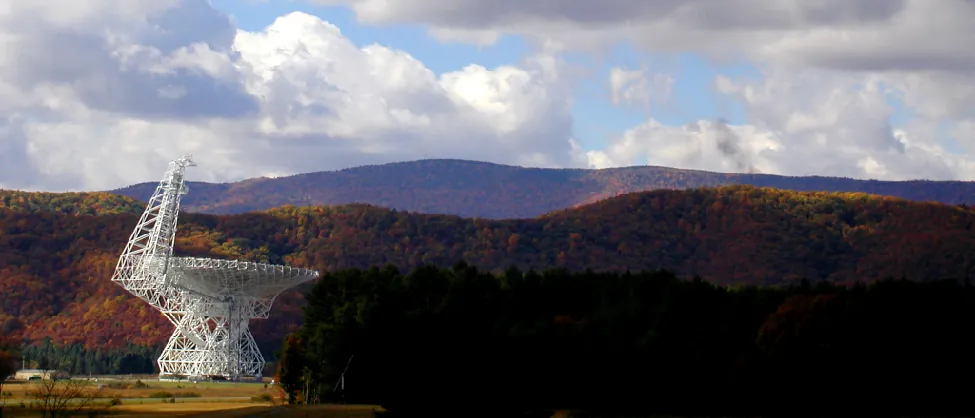
tremendous growth in recent decades. The world’s largest radio reflectors that can be pointed to
any direction in the sky have apertures of 100 meters. One of these has been built at the US
National Radio Astronomy Observatory in West Virginia (Figure 6.19). Table 6.2 lists some of the
major radio telescopes of the world.
Figure 6.19 Robert C. Byrd Green Bank Telescope. This fully steerable radio telescope in West
Virginia went into operation in August 2000. Its dish is about 100 meters across. (credit:
modification of work by “b3nscott”/Flickr)
Table 6.2: Major Radio Observatories of the World
| Observatory | Location | Description | Website |
| Individual Radio Dishes
| Five-hundred-meter Aperture Spherical radio Telescope (FAST) | Guizhou, China | 500-m fixed dish | fast.bao.ac.cn/en/ |
| Arecibo Observatory | Arecibo, Puerto Rico | 305-m fixed dish | www.naic.edu |
| Green Bank Telescope (GBT) | Green Bank, WV | 110 × 100-m steerable dish | www.science.nrao.edu/facilities/gbt |
| Effelsberg 100-m Telescope | Bonn, Germany | 100-m steerable dish | www.mpifr-bonn.mpg.de/en/effelsberg |
| Lovell Telescope | Manchester, England | 76-m steerable dish | www.jb.man.ac.uk/aboutus/lovell |
| Canberra Deep Space Communication Complex (CDSCC) | Tidbinbilla, Australia | 70-m steerable dish | www.cdscc.nasa.gov |
| Goldstone Deep Space Communications Complex (GDSCC) | Barstow, CA | 70-m steerable dish | www.gdscc.nasa.gov |
| Parkes Observatory | Parkes, Australia | 64-m steerable dish | www.parkes.atnf.csiro.au |
| Arrays of Radio Dishes
| square Kilometre Array (SKA) | South Africa and Western Australia | Thousands of dishes, km2 collecting area, partial array in 2020 | www.skatelescope.org |
| Atacama Large Millimeter/submillimeter Array (ALMA) | Atacama desert, Northern Chile | 66 7-m and 12-m dishes | www.almaobservatory.org |
| Jansky Very Large Array (VLA) | Socorro, New Mexico | 27-element array of 25-m dishes (36-km baseline) | www.science.nrao.edu/facilities/vla |
| Westerbork Synthesis Radio Telescope (WSRT) | Westerbork, the Netherlands | 12-element array of 25-m dishes (1.6-km baseline) | www.astron.nl/radio-observatory/public/public-0 |
| Very Long Baseline Array (VLBA) | Ten US sites, HI to the Virgin Islands | 10-element array of 25-m dishes (9000 km baseline) | www.science.nrao.edu/facilities/vlba |
| Australia Telescope Compact Array (ATCA) | Several sites in Australia | 8-element array (seven 22-m dishes plus Parkes 64 m) | www.narrabri.atnf.csiro.au |
| Multi-Element Radio Linked Interferometer Network (MERLIN) | Cambridge, England, and other British sites | Network of seven dishes (the largest is 32 m) | www.e-merlin.ac.uk |
| Millimeter-wave Telescopes
| IRAM | Granada, Spain | 30-m steerable mm-wave dish | www.iram-institute.org |
| James Clerk Maxwell Telescope (JCMT) | Maunakea, HI | 15-m steerable mm-wave dish | www.eaobservatory.org/jcmt |
| Nobeyama Radio Observatory (NRO) | Minamimaki, Japan | 6-element array of 10-m wave dishes | www.nro.nao.ac.jp/en |
| Hat Creek Radio Observatory (HCRO) | Cassel, CA | 6-element array of 5-m wave dishes | www.sri.com/research-development/specialized-facilities/hat-creek-radio-observatory |
Radio Interferometry
As we discussed earlier, a telescope’s ability to show us fine detail (its resolution) depends upon its
aperture, but it also depends upon the wavelength of the radiation that the telescope is gathering.
The longer the waves, the harder it is to resolve fine detail in the images or maps we make.
Because radio waves have such long wavelengths, they present tremendous challenges for
astronomers who need good resolution.
In fact, even the largest radio dishes on Earth, operating alone, cannot make out as much detail as
the typical small visible-light telescope used in a college astronomy lab. To overcome this difficulty,
radio astronomers have learned to sharpen their images by linking two or more radio telescopes
together electronically. Two or more telescopes linked together in this way are called an
interferometer.
“Interferometer” may seem like a strange term because the telescopes in an interferometer work
cooperatively; they don’t “interfere” with each other. Interference, however, is a technical
term for the way that multiple waves interact with each other when they arrive in our
instruments, and this interaction allows us to coax more detail out of our observations.
The resolution of an interferometer depends upon the separation of the telescopes, not
upon their individual apertures. Two telescopes separated by 1 kilometer provide the
same resolution as would a single dish 1 kilometer across (although they are not, of
course, able to collect as much radiation as a radio-wave bucket that is 1 kilometer
across).
To get even better resolution, astronomers combine a large number of radio dishes into an
interferometer array. In effect, such an array works like a large number of two-dish interferometers,
all observing the same part of the sky together. Computer processing of the results permits the
reconstruction of a high-resolution radio image. The most extensive such instrument in the
United States is the National Radio Astronomy Observatory’s Jansky Very Large Array
(VLA) near Socorro, New Mexico. It consists of 27 movable radio telescopes (on railroad
tracks), each having an aperture of 25 meters, spread over a total span of about 36
kilometers. By electronically combining the signals from all of its individual telescopes, this
array permits the radio astronomer to make pictures of the sky at radio wavelengths
comparable to those obtained with a visible-light telescope, with a resolution of about 1
arcsecond.
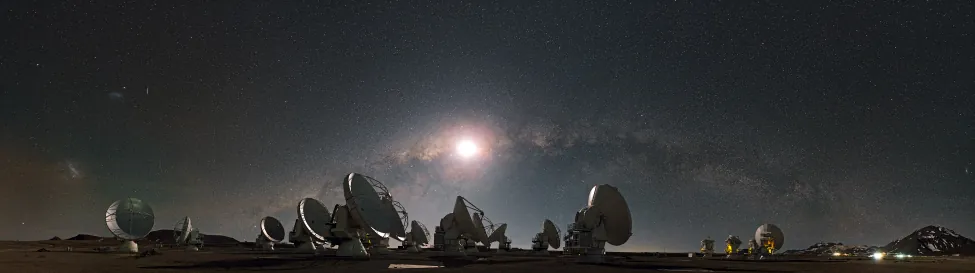
The Atacama Large Millimeter/submillimeter array (ALMA) in the Atacama Desert of Northern
Chile (Figure 6.20), at an altitude of 16,400 feet, consists of 12 7-meter and 54 12-meter telescopes,
and can achieve baselines up to 16 kilometers. Since it became operational in 2013, it has made
observations at resolutions down to 6 milliarcseconds (0.006 arcseconds), a remarkable achievement
for radio astronomy.
Figure 6.20 Atacama Large Millimeter/Submillimeter Array (ALMA). Located in the Atacama
Desert of Northern Chile, ALMA currently provides the highest resolution for radio observations.
(credit: ESO/S. Guisard)
Link to Learning
Watch the documentary that explains the work that went into designing and building ALMA,
discusses some of its first images, and explores its future.
Initially, the size of interferometer arrays was limited by the requirement that all of the dishes be
physically wired together. The maximum dimensions of the array were thus only a few tens of
kilometers. However, larger interferometer separations can be achieved if the telescopes do not
require a physical connection.
Astronomers, with the use of current technology and computing power, have learned to time the
arrival of electromagnetic waves coming from space very precisely at each telescope and combine
the data later. If the telescopes are as far apart as California and Australia, or as West
Virginia and Crimea in Ukraine, the resulting resolution far surpasses that of visible-light
telescopes.
The United States operates the Very Long Baseline Array (VLBA), made up of 10 individual
telescopes stretching from the Virgin Islands to Hawaii (Figure 6.21). The VLBA, completed in
1993, can form astronomical images with a resolution of 0.0001 arcseconds, permitting
features as small as 10 astronomical units (AU) to be distinguished at the center of our
Galaxy.
Figure 6.21 Very Long Baseline Array. This map shows the distribution of 10 antennas
that constitute an array of radio telescopes stretching across the United States and its
territories.
Recent advances in technology have also made it possible to do interferometry at visible-light and
infrared wavelengths. At the beginning of the twenty-first century, three observatories with
multiple telescopes each began using their dishes as interferometers, combining their light to obtain
a much greater resolution. In addition, a dedicated interferometric array was built on Mt. Wilson
in California. Just as in radio arrays, these observations allow astronomers to make out more detail
than a single telescope could provide.
Table 6.3: Visible-Light Interferometers
Longest
Baseline
(m) | Telescope Name | Location | Mirrors / Status |
400 | CHARA Array (Center for
High Angular Resolution
Astronomy) | Mount Wilson,
CA | Six 1-m telescopes;
operational since 2004 |
200 | Very Large Telescope | Cerro Paranal,
Chile | Four 8.2-m telescopes;
completed 2000 |
85 | Keck I and II telescopes | Maunakea, HI | Two 10-m telescopes;
operated from 2001 to
2012 |
22.8 | Large Binocular Telescope | Mount Graham,
AZ | Two 8.4-m telescopes;
first light 2004 |
Radar Astronomy
Radar is the technique of transmitting radio waves to an object in our solar system and then
detecting the radio radiation that the object reflects back. The time required for the round trip can
be measured electronically with great precision. Because we know the speed at which radio waves
travel (the speed of light), we can determine the distance to the object or a particular feature on
its surface (such as a mountain).
Radar observations have been used to determine the distances to planets and how fast things are
moving in the solar system (using the doppler effect, discussed in the Radiation and Spectra
chapter). Radar waves have played important roles in navigating spacecraft throughout the solar
system.
In addition, as will be discussed in later chapters, radar observations have determined the rotation
periods of Venus and Mercury, probed tiny Earth-approaching asteroids, and allowed us to
investigate the mountains and valleys on the surfaces of Mercury, Venus, Mars, and the large
moons of Jupiter.
Any radio dish can be used as a radar telescope if it is equipped with a powerful transmitter as
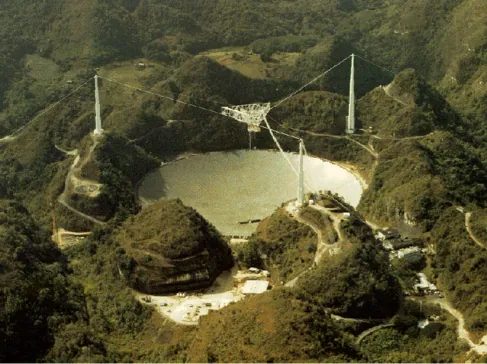
well as a receiver. For many years, the most spectacular facility in the world for radar astronomy
was the 1000-foot (305-meter) telescope at Arecibo in Puerto Rico (Figure 6.22). The Arecibo
telescope was too large to be pointed directly at different parts of the sky. Instead, it was
constructed in a huge natural “bowl” (more than a mere dish) formed by several hills, and it was
lined with reflecting metal panels. A limited ability to track astronomical sources was achieved by
moving the receiver system, which was suspended on cables 100 meters above the surface of the
bowl. Unfortunately, the telescope was seriously damaged in the powerful storms of 2020 and had
to be decommissioned.
An even larger (500-meter) radar telescope has recently gone into operation in China and is called
the Five-hundred-meter Aperture Spherical Telescope (FAST).
Figure 6.22 Largest Radio and Radar Dish. The Arecibo Observatory in Puerto Rico was the
largest and most powerful astronomical radar faculty in the world and was often featured in films.
In November 2020 it collapsed, damaging the 300-meter diameter “dish” and destroying the radar
transmitter and receiver. (credit: National Astronomy and Ionosphere Center, Cornell U.,
NSF)
Attribution
Access for free at openstax.org.
Bibliography
This entry is a derivative work of the original March 9, 2022 release identified in [1].
[1] Andrew Fraknoi, David Morrison, and Sidney C. Wolff, Astronomy 2e. Houston, Texas:
OpenStax, March 9, 2022. Digital ISBN 978-1-951693-50-3. Textbook content produced by
OpenStax in this edition is licensed under the Creative Commons Attribution 4.0 International
License (CC BY 4.0), except where otherwise noted. Changes: converted to LaTeX for
PhysicsLibrary. Access for free at openstax.org.