Color in Astrophysics: Definition, Color Indices, and Physical Interpretation
In everyday language, color describes a visual sensation.
In astrophysics, color usually has a more precise quantitative meaning:
The most common quantitative measure is a color index, defined as the difference between two
magnitudes.
If a source has magnitudes mX and mY in bands X and Y , then
Examples include
| U − B, | | (2)
|
| B − V, | | (3)
|
| g − r, | | (4)
|
| GBP − GRP . | | (5) |
A color index is therefore a logarithmic measure of the shape of the source’s spectral energy
distribution.
It is not merely a descriptive label such as “blue star” or “red star.”
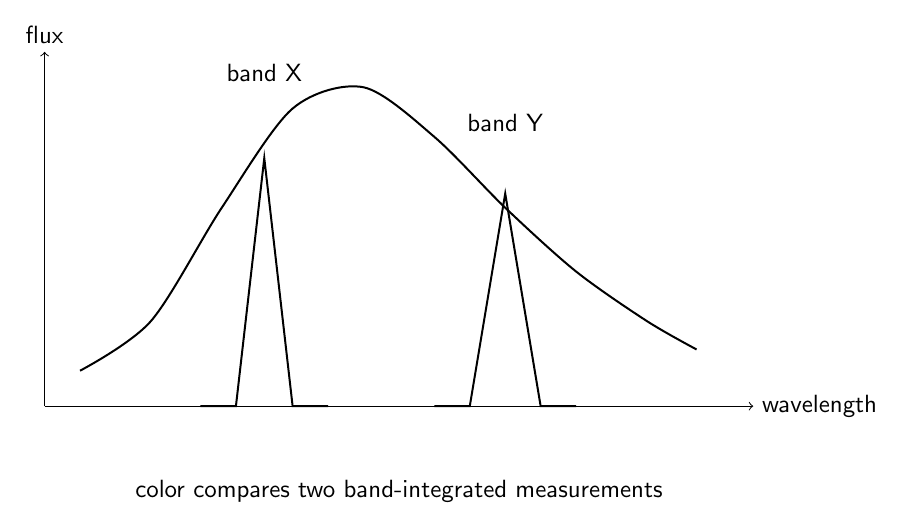
Figure 1. Astrophysical color compares the amount of radiation measured through two different
photometric bandpasses.
1 Why magnitude differences measure color
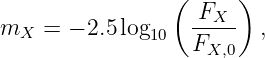
A magnitude in band X can be written schematically as
where
- FX is the appropriately band-averaged observed flux or flux density,
- FX,0 is the reference zero-point quantity for that photometric system.
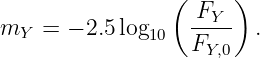
Likewise,
Subtracting gives
| mX − mY = | − 2.5 log 10 | |
|
| + 2.5 log 10 . . | (4) |
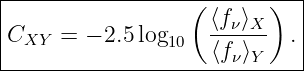
Thus the color index measures a flux ratio, together with the zero-point convention of the
photometric system.
2 The special simplicity of an AB color
In the AB magnitude system, the reference spectrum has constant flux density per unit
frequency.
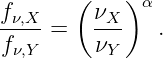
For two idealized bands represented by their band-averaged flux densities,
and the same reference fν,0 is used for both bands.
The zero point therefore cancels:
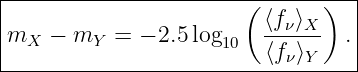
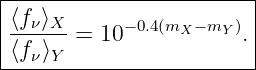
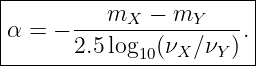
Hence
Equation (5) is especially useful for understanding the physical meaning of color.
Real broadband photometry still requires the complete system throughput and a precise
convention for the band-averaged flux density.
3 What does a smaller color index mean?
Suppose band X is at shorter wavelength than band Y .
If
becomes smaller or more negative, the source is relatively brighter in the shorter-wavelength
band.
Astronomers usually describe this as bluer.
If the color index becomes larger and more positive, the source is relatively stronger in the
longer-wavelength band.
Astronomers usually describe this as redder.
Thus, for a conventional blue-minus-visual color such as B − V ,
while
The numerical zero of a color depends on the adopted magnitude system and bandpasses.
4 Color is a property of the spectral energy distribution
A source spectrum is a function such as
or
A photometric band samples a weighted part of that spectrum.
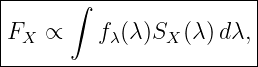
Schematically, a detected band signal has the form
where SX(λ) represents the total system response.
Depending on detector and calibration convention, photon-counting factors and normalization
terms must also be included.
The important point is that a broadband magnitude is not simply the spectrum evaluated at one
wavelength.
A color compares two weighted integrals over the spectral energy distribution.
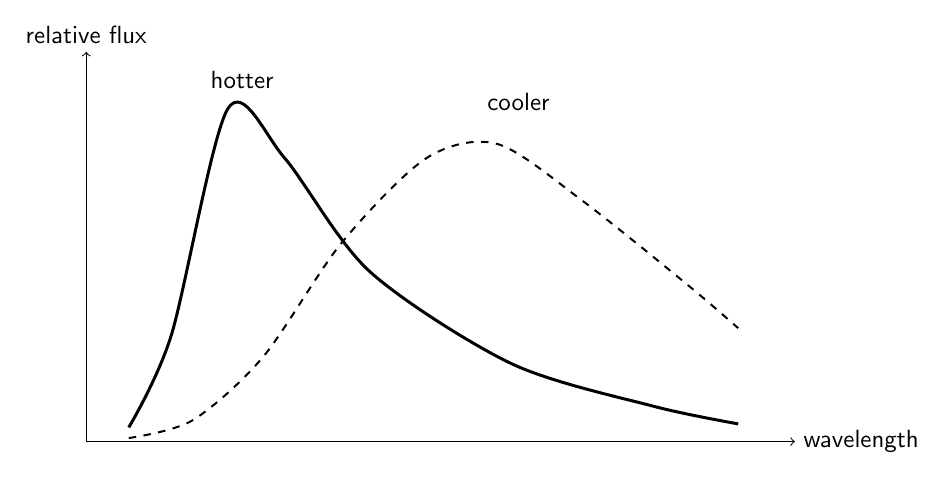
Figure 2. Hotter and cooler stellar spectra distribute their radiative output differently with
wavelength, producing different photometric colors.
5 Color and stellar temperature
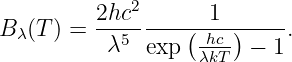
For a blackbody,
As temperature increases, the spectral energy distribution shifts toward shorter wavelengths.
Consequently, stellar color is strongly related to effective temperature.
For ordinary stellar photospheres,
However, color is not determined by temperature alone.
It is also influenced by:
- surface gravity,
- chemical composition,
- absorption lines and molecular bands,
- interstellar extinction,
- circumstellar material,
- unresolved companions.
Therefore a color-temperature relation is a calibration, not a universal one-to-one law.
6 Color temperature
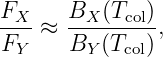
A color temperature is the temperature of a blackbody whose flux ratio between selected
wavelength regions reproduces an observed color.
If an observed ratio satisfies
then Tcol is the inferred color temperature.
For a real star,
need not be identical to
The distinction matters because stellar spectra contain wavelength-dependent opacity, spectral
lines, and deviations from an ideal blackbody.
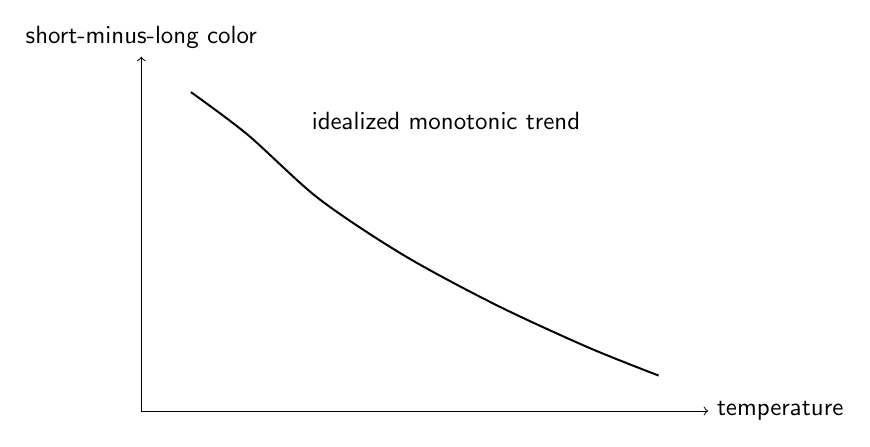
Figure 3. A color temperature matches a selected spectral slope or flux ratio to a blackbody and
need not equal the stellar effective temperature exactly.
7 Common stellar color indices
Several systems are widely used.
7.1 Johnson-Cousins system
Examples include
The classic B − V index compares blue and visual-band magnitudes.
7.2 SDSS-like optical systems
A common sequence is
7.3 Gaia
A widely used Gaia color is
This compares Gaia’s broad blue-photometer and red-photometer measurements.
Colors from different photometric systems should not be treated as numerically interchangeable.
8 Observed color and intrinsic color
The color directly measured by the observer is the observed color.
The color the source would have in the absence of intervening extinction is the intrinsic
color.
For example,
is the observed color, while
is the intrinsic color.
The difference is the color excess:
More generally,
9 Why extinction changes color
Let the intrinsic magnitudes be
Interstellar extinction adds
so that
| mX | = mX,0 + AX, | (22)
|
| mY | = mY,0 + AY . | (23) |
Subtracting,
| mX − mY | = (mX,0 − mY,0) + (AX − AY ). | (24) |
Therefore
For ordinary interstellar dust at optical wavelengths, shorter wavelengths are usually extinguished
more strongly.
Thus dust generally makes an object appear redder.
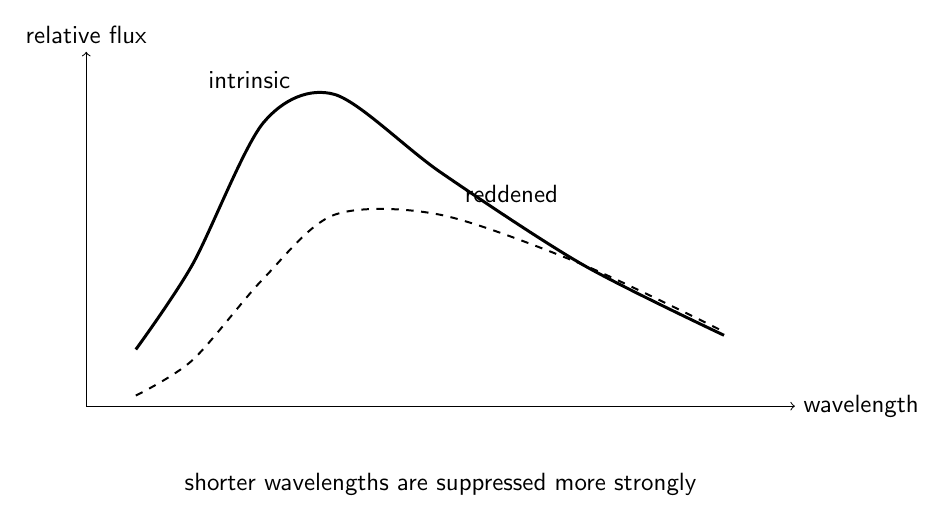
Figure 4. Wavelength-dependent extinction suppresses shorter-wavelength light more strongly and
shifts many optical colors toward redder values.
10 Dereddening a color
Once the color excess is known,
Similarly, if the extinction in one band is known,
Color correction and magnitude correction are related but are not the same operation.
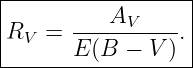
11 The extinction parameter 
A commonly used optical parameter is
A value near
is often used as an illustrative diffuse Milky Way value, but real sightlines can differ
substantially.
One should not treat RV = 3.1 as universal.
12 Color-color diagrams
A color-color diagram plots one color index against another.
For example,
may be plotted against
Such diagrams are useful because:
- stellar temperature moves stars along characteristic loci,
- reddening often moves sources in a different direction,
- unusual spectra can be identified,
- quasars, white dwarfs, cool stars, and other populations can separate in color space.
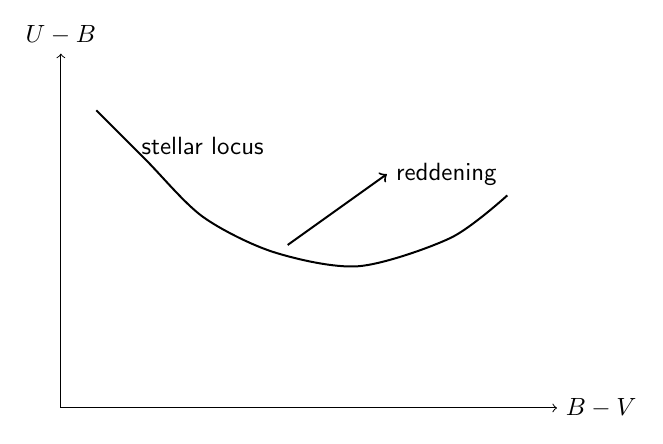
Figure 5. A color-color diagram compares two independent spectral slopes and can help separate
temperature, reddening, and unusual spectral energy distributions.
13 Color-magnitude diagrams
A color-magnitude diagram places a color index on one axis and a magnitude or absolute
magnitude on the other.
For a stellar population, this produces recognizable structures such as:
- the main sequence,
- giant branches,
- white-dwarf sequences,
- binary sequences,
- turnoff regions.
A color-magnitude diagram is observationally related to the Hertzsprung-Russell diagram.
Color provides a temperature-sensitive horizontal coordinate, while magnitude provides a
luminosity-sensitive vertical coordinate.
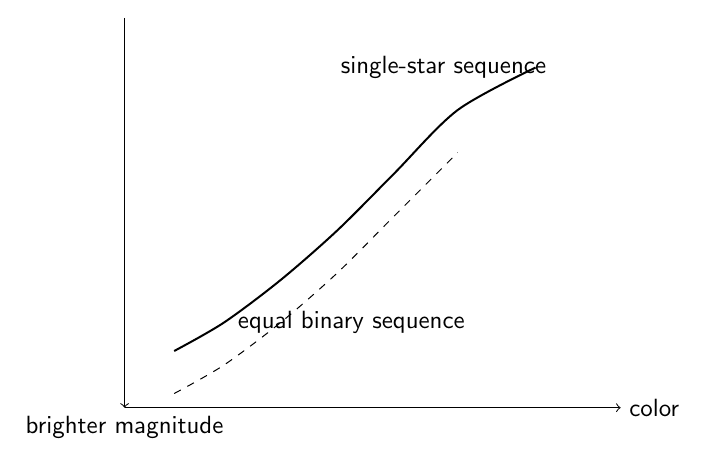
Figure 6. Color-magnitude diagrams use a photometric color as a temperature-sensitive
coordinate and a magnitude as a luminosity-sensitive coordinate.
14 Color and a power-law spectrum
Suppose over a limited range the spectrum can be approximated by
For two idealized AB bands centered at frequencies νX and νY ,
Using Equation (5),
Thus
A color index can therefore be interpreted as a coarse measurement of spectral slope.
15 Color uncertainty
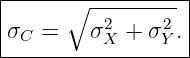
If
and the magnitude errors are independent, then
If the two measurements have covariance,
This is important because the same calibration errors can affect both bands and make the errors
correlated.
16 Color of an unresolved binary
Fluxes add before magnitudes are calculated.
For two unresolved components,
| FX,tot | = FX,1 + FX,2, | (32)
|
| FY,tot | = FY,1 + FY,2. | (33) |
Therefore the combined color is
| Ctot = | − 2.5 log 10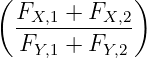 | |
|
| + 2.5 log 10 . . | (19) |
The combined color is generally not the arithmetic average of the two component colors.

Figure 7. In an unresolved binary the component fluxes add separately in each band before the
combined color index is calculated.
17 Equal-component binary
If the two unresolved stars have identical spectra, then both band fluxes double:
| FX,tot | = 2FX, | (34)
|
| FY,tot | = 2FY . | (35) |
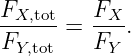
Their ratio is unchanged:
Therefore
The unresolved system is brighter but has the same color.
This is why equal-component binaries can form a sequence above the single-star main sequence in
a color-magnitude diagram without shifting strongly in color.
18 Color variations during eclipses
An eclipsing binary whose two stars have different temperatures can change color during
eclipse.
If the hotter star is partially or completely hidden, the combined light can become redder.
If the cooler star is hidden, the combined light can become bluer.
Thus time-dependent color provides information about the relative spectral energy distributions of
the components.
This is a direct connection between color photometry and the eclipsing binary geometry developed
elsewhere in the binary star sequence.
19 Photometric calibration matters
A scientifically meaningful color requires calibrated measurements.
Important corrections include:
- detector bias and dark signal,
- flat-field response,
- atmospheric extinction for ground-based data,
- zero-point calibration,
- color terms between an instrumental and standard system,
- aperture or point-spread-function consistency,
- time variability between exposures taken in different filters.
An instrumental color is not automatically a standard-system color.
20 Why filter definitions matter
A color index belongs to a particular photometric system.
The designation
does not mean “flux at exactly one blue wavelength minus flux at exactly one visual
wavelength.”
It represents measurements through specified bandpasses, detectors, and calibration
conventions.
Changes in filter throughput can produce systematic color transformations.
This is one reason standard-star observations and synthetic photometry are important.
21 Common mistakes
- Treating astrophysical color as only a visual RGB description.
- Forgetting that color is a magnitude difference and therefore logarithmic.
- Assuming a larger blue-minus-red color means a bluer source.
- Mixing colors from different photometric systems as if they were identical.
- Converting a broadband magnitude to flux using only a nominal central wavelength
without regard to the bandpass convention.
- Assuming color uniquely determines effective temperature.
- Ignoring interstellar reddening.
- Treating observed color as intrinsic color.
- Assuming RV = 3.1 for every sightline.
- Averaging component colors arithmetically for an unresolved binary.
- Forgetting that fluxes add before magnitudes and colors are calculated.
- Ignoring covariance when propagating color uncertainty.
- Comparing non-simultaneous colors of a rapidly variable source without caution.
22 Connections to BIN02 and luminosity
BIN02 introduced observational fluxes, magnitudes, and broadband measurements.
The present definition article isolates the specific concept of astrophysical color.
The luminosity article addresses the total emitted Power.
Color instead asks how that power or observed flux is distributed with wavelength.
The two concepts therefore answer different questions:
Together, luminosity and color provide much of the observational foundation for stellar
classification, temperature estimation, and color-magnitude diagrams.
23 Summary
The fundamental color index is
In an idealized AB comparison,
For a shorter-wavelength band X and longer-wavelength band Y , a smaller color generally
indicates a bluer spectral energy distribution.
The intrinsic and observed colors are connected by
Color is strongly sensitive to temperature, but also to extinction, surface gravity, composition,
spectral features, and unresolved companions.
For an unresolved binary, fluxes must be added separately in each band before the system color is
calculated.
References
References
[1] B. W. Carroll and D. A. Ostlie, An Introduction to Modern Astrophysics, 2nd ed.,
Cambridge University Press, 2017.
[2] M. S. Bessell, Standard Photometric Systems, Annual Review of Astronomy and
Astrophysics, 43, 293–336, 2005.
[3] M. S. Bessell, F. Castelli, and B. Plez, Model atmospheres broad-band colors,
bolometric corrections and temperature calibrations for O–M stars, Astronomy and
Astrophysics, 333, 231–250, 1998.
[4] D. W. Hogg et al., Astronomical magnitudes and fluxes, pedagogical notes on
astronomical photometric conventions.