Electromagnetic radiation carries a lot of information about the nature of stars and other
astronomical objects. To extract this information, however, astronomers must be able to study the
amounts of energy we receive at different wavelengths of Light in fine detail. Let’s examine how we
can do this and what we can learn.
Properties of Light
Light exhibits certain behaviors that are important to the design of telescopes and other
instruments. For example, light can be reflected from a surface. If the surface is smooth and shiny,
as with a mirror, the direction of the reflected light beam can be calculated accurately from
knowledge of the shape of the reflecting surface. Light is also bent, or refracted, when it
passes from one kind of transparent material into another—say, from the air into a glass
lens.
Reflection and refraction of light are the basic properties that make possible all optical instruments
(devices that help us to see things better)—from eyeglasses to giant astronomical telescopes.
Such instruments are generally combinations of glass lenses, which bend light according
to the principles of refraction, and curved mirrors, which depend on the properties of
reflection.
Small optical devices, such as eyeglasses or binoculars, generally use lenses, whereas large
telescopes depend almost entirely on mirrors for their main optical elements. We will
discuss astronomical instruments and their uses more fully in Astronomical Instruments.
For now, we turn to another behavior of light, one that is essential for the decoding of
light.
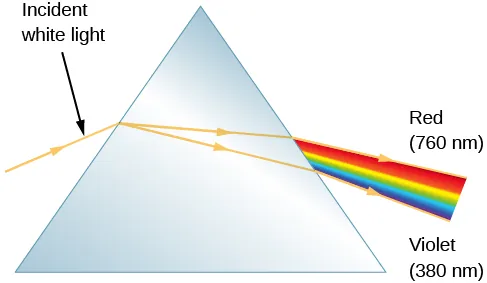
In 1672, in the first paper that he submitted to the Royal Society, Sir Isaac Newton described an
experiment in which he permitted sunlight to pass through a small hole and then through a prism.
Newton found that sunlight, which looks white to us, is actually made up of a mixture of all the
colors of the rainbow (Figure 5.9).
Figure 5.9 Action of a Prism. When we pass a beam of white sunlight through a prism, we see a
rainbow-colored band of light that we call a continuous spectrum.
Figure 5.9 shows how light is separated into different colors with a prism—a piece of glass in
the shape of a triangle with refracting surfaces. Upon entering one face of the prism,
the path of the light is refracted (bent), but not all of the colors are bent by the same
amount.
The bending of the beam depends on the wavelength of the light as well as the properties of the
material, and as a result, different wavelengths (or colors of light) are bent by different amounts
and therefore follow slightly different paths through the prism. The violet light is bent more
than the red. This phenomenon is called dispersion and explains Newton’s rainbow
experiment.
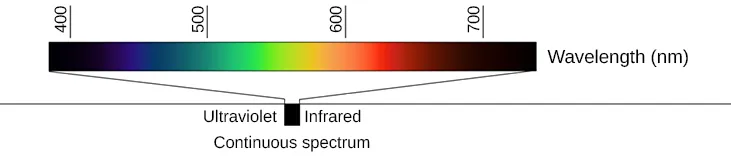
Upon leaving the opposite face of the prism, the light is bent again and further dispersed. If the
light leaving the prism is focused on a screen, the different wavelengths or colors that make up
white light are lined up side by side just like a rainbow (Figure 5.10).
(In fact, a rainbow is formed by the dispersion of light though raindrops; see The Rainbow feature
box.) Because this array of colors is a spectrum of light, the instrument used to disperse the light
and form the spectrum is called a spectrometer.
Figure 5.10 Continuous Spectrum. When white light passes through a prism, it is dispersed and
forms a continuous spectrum of all the colors.
Although it is hard to see in this printed version, in a well-dispersed spectrum, many
subtle gradations in color are visible as your eye scans from one end (violet) to the other
(red).
The Value of Stellar Spectra
When Newton described the laws of refraction and dispersion in optics, and observed the solar
spectrum, all he could see was a continuous band of colors. If the spectrum of the white light from
the Sun and stars were simply a continuous rainbow of colors, astronomers would have little
interest in the detailed study of a star’s spectrum once they had learned its average surface
temperature.
In 1802, however, William Wollaston built an improved spectrometer that included a lens to focus
the Sun’s spectrum on a screen. With this device, Wollaston saw that the colors were not spread
out uniformly, but instead, some ranges of color were missing, appearing as dark bands in the
solar spectrum. He mistakenly attributed these lines to natural boundaries between the
colors.
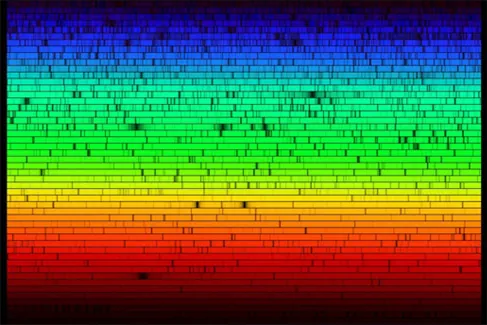
In 1815, German physicist Joseph Fraunhofer, upon a more careful examination of the solar
spectrum, found about 600 such dark lines (missing colors), which led scientists to rule out the
boundary hypothesis (Figure 5.11).
Figure 5.11 Visible Spectrum of the Sun. Our star’s spectrum is crossed by dark lines produced by
atoms in the solar atmosphere that absorb light at certain wavelengths. (credit: modification of
work by Nigel Sharp, NOAO/National Solar Observatory at Kitt Peak/AURA, and the National
Science Foundation)
Later, researchers found that similar dark lines could be produced in the spectra (“spectra” is the
plural of “spectrum”) of artificial light sources. They did this by passing their light through various
apparently transparent substances—usually containers with just a bit of thin gas in
them.
These gases turned out not to be transparent at all colors: they were quite opaque at a few sharply
defined wavelengths. Something in each gas had to be absorbing just a few colors of light and no
others. All gases did this, but each different element absorbed a different set of colors and thus
showed different dark lines. If the gas in a container consisted of two elements, then
light passing through it was missing the colors (showing dark lines) for both of the
elements.
So it became clear that certain lines in the spectrum “go with” certain elements. This discovery
was one of the most important steps forward in the history of astronomy.
What would happen if there were no continuous spectrum for our gases to remove light from?
What if, instead, we heated the same thin gases until they were hot enough to glow with their own
light? When the gases were heated, a spectrometer revealed no continuous spectrum, but several
separate bright lines. That is, these hot gases emitted light only at certain specific wavelengths or
colors.
When the gas was pure hydrogen, it would emit one pattern of colors; when it was pure sodium, it
would emit a different pattern. A mixture of hydrogen and sodium emitted both sets
of spectral lines. The colors the gases emitted when they were heated were the very
same colors as those they had absorbed when a continuous source of light was behind
them.
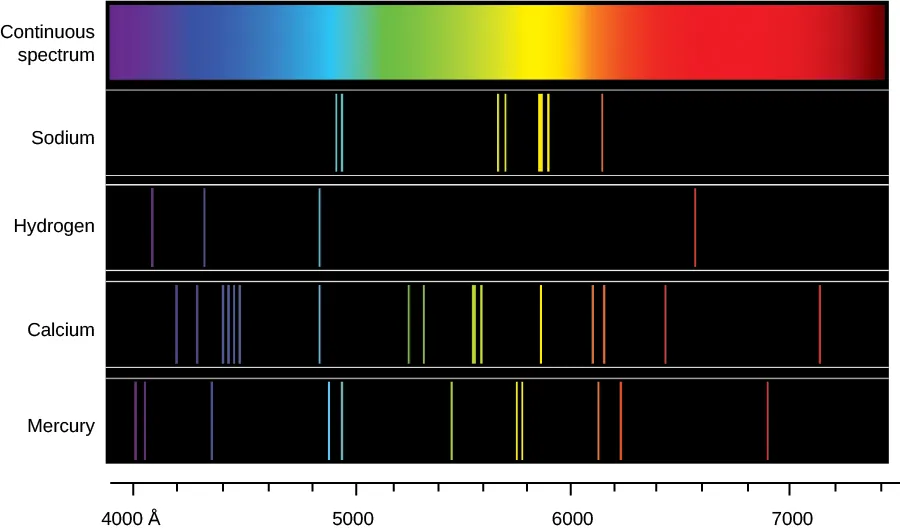
From such experiments, scientists began to see that different substances showed distinctive
spectral signatures by which their presence could be detected (Figure 5.12). Just as
your signature allows the bank to identify you, the unique pattern of colors for each
type of atom (its spectrum) can help us identify which element or elements are in a
gas.
Figure 5.12 Continuous Spectrum and Line Spectra from Different Elements. Each type of glowing
gas (each element) produces its own unique pattern of lines, so the composition of a gas can be
identified by its spectrum. The spectra of sodium, hydrogen, calcium, and mercury gases are shown
here.
Types of Spectra
In these experiments, then, there were three different types of spectra. A continuous spectrum
(formed when a solid or very dense gas gives off radiation) is an array of all wavelengths or colors
of the rainbow. A continuous spectrum can serve as a backdrop from which the atoms of much less
dense gas can absorb light. A dark line, or absorption spectrum, consists of a series or
pattern of dark lines—missing colors—superimposed upon the continuous spectrum of a
source.
A bright line, or emission spectrum, appears as a pattern or series of bright lines; it consists of
light in which only certain discrete wavelengths are present. (Figure 5.11 shows an absorption
spectrum, whereas Figure 5.12 shows the emission spectrum of a number of common elements
along with an example of a continuous spectrum.)
When we have a hot, thin gas, each particular chemical element or compound produces its own
characteristic pattern of spectral lines—its spectral signature. No two types of atoms or molecules
give the same patterns. In other words, each particular gas can absorb or emit only certain
wavelengths of the light peculiar to that gas. In contrast, absorption spectra occur when passing
white light through a cool, thin gas.
The temperature and other conditions determine whether the lines are bright or dark (whether
light is absorbed or emitted), but the wavelengths of the lines for any element are the same in
either case. It is the precise pattern of wavelengths that makes the signature of each element
unique. Liquids and solids can also generate spectral lines or bands, but they are broader and less
well defined—and hence, more difficult to interpret. Spectral analysis, however, can be quite
useful.
It can, for example, be applied to light reflected off the surface of a nearby asteroid as well as to
light from a distant galaxy.
The dark lines in the solar spectrum thus give evidence of certain chemical elements between us
and the Sun absorbing those wavelengths of sunlight. Because the space between us and the Sun is
pretty empty, astronomers realized that the atoms doing the absorbing must be in a thin
atmosphere of cooler gas around the Sun. This outer atmosphere is not all that different from the
rest of the Sun, just thinner and cooler.
Thus, we can use what we learn about its composition as an indicator of what the whole Sun is
made of. Similarly, we can use the presence of absorption and emission lines to analyze the
composition of other stars and clouds of gas in space.
Such analysis of spectra is the key to modern astronomy. Only in this way can we “sample” the
stars, which are too far away for us to visit. Encoded in the electromagnetic radiation from
celestial objects is clear information about the chemical makeup of these objects. Only by
understanding what the stars were made of could astronomers begin to form theories about what
made them shine and how they evolved.
In 1860, German physicist Gustav Kirchhoff became the first person to use spectroscopy to identify
an element in the Sun when he found the spectral signature of sodium gas. In the years that
followed, astronomers found many other chemical elements in the Sun and stars. In
fact, the element helium was found first in the Sun from its spectrum and only later
identified on Earth. (The word “helium” comes from helios, the Greek name for the
Sun.)
Why are there specific lines for each element? The answer to that question was not found until the
twentieth century; it required the development of a model for the atom. We therefore turn next to
a closer examination of the atoms that make up all matter.
Link to Learning
You can use the Spectrum Constructor (https://openstax.org/l/30spectcoord) to explore the three
types of spectra and how they appear through a diffraction grating when the brightness of each
wavelength is measured with a spectrometer.
Making Connections
The Rainbow
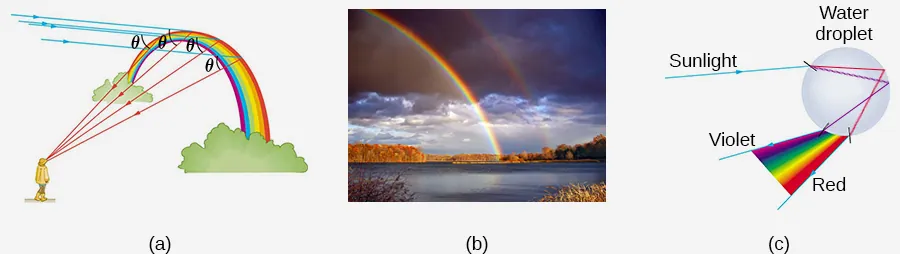
Rainbows are an excellent illustration of the dispersion of sunlight. You have a good chance of
seeing a rainbow any time you are between the Sun and a rain shower, as illustrated in Figure 5.13.
The raindrops act like little prisms and break white light into the spectrum of colors. Suppose a
ray of sunlight encounters a raindrop and passes into it. The light changes direction—is
refracted—when it passes from air to water; the blue and violet light are refracted more than the
red.
Some of the light is then reflected at the backside of the drop and reemerges from the front,
where it is again refracted. As a result, the white light is spread out into a rainbow of
colors.
Figure 5.13 Rainbow Refraction. (a) This diagram shows how light from the Sun, which is located
behind the observer, can be refracted by raindrops to produce (b) a rainbow. (c) Refraction
separates white light into its component colors.
Note that violet light lies above the red light after it emerges from the raindrop. When you look at
a rainbow, however, the red light is higher in the sky. Why? Look again at Figure 5.13. If the
observer looks at a raindrop that is high in the sky, the violet light passes over her head and the
red light enters her eye.
Similarly, if the observer looks at a raindrop that is low in the sky, the violet light reaches her eye
and the drop appears violet, whereas the red light from that same drop strikes the ground and is
not seen. Colors of intermediate wavelengths are refracted to the eye by drops that
are intermediate in altitude between the drops that appear violet and the ones that
appear red. Thus, a single rainbow always has red on the outside and violet on the
inside.
Bibliography
This article is a derivative work of the Creative Commons source in [1].
[1] Andrew Fraknoi, David Morrison, and Sidney Wolff, “5.3 Spectroscopy in Astronomy,” in
Astronomy 2e. Houston, Texas: OpenStax, 2022. Licensed CC BY 4.0 in the original
2022 release (https://creativecommons.org/licenses/by/4.0/). Changes: converted to
LaTeX for PhysicsLibrary; no numbered worked examples occur in section 5.3. Access for
free at https://openstax.org/books/astronomy-2e/pages/1-introduction. Section source:
https://openstax.org/books/astronomy-2e/pages/5-3-spectroscopy-in-astronomy.